Mathematics is often seen as challenging, but tools like the 1-100 multiplication chart can make it much easier and more approachable. This powerful visual aid allows learners to understand multiplication on a larger scale, promoting confidence and a deeper understanding of numbers.
What Is a Multiplication Chart 1-100?
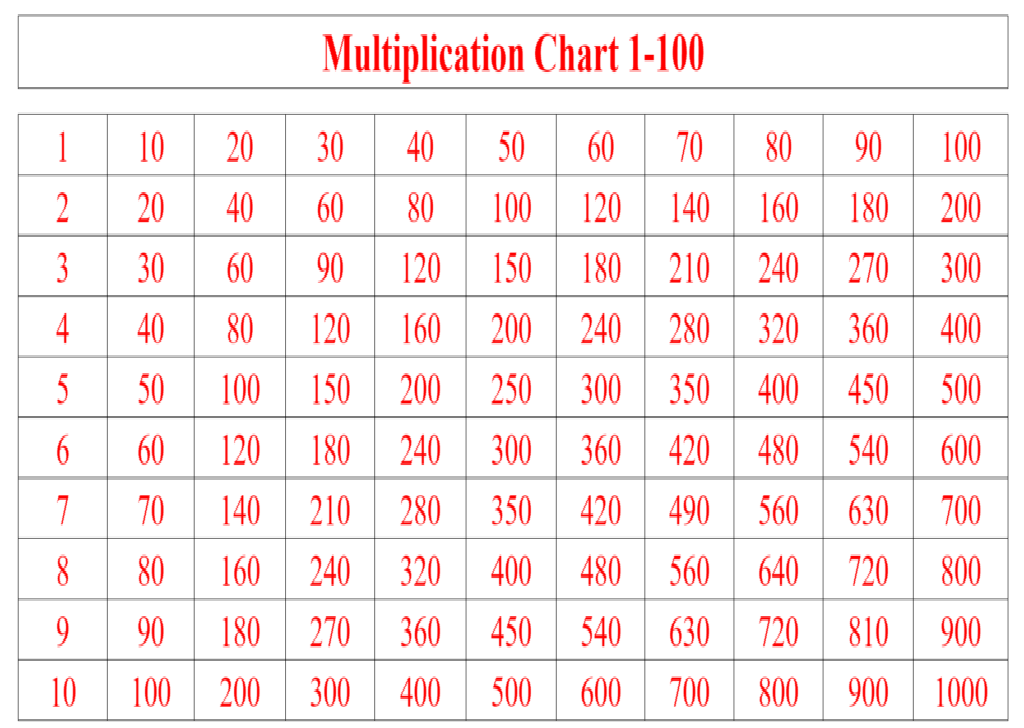
A 1-100 multiplication chart is a grid that shows the product of two numbers between 1 and 100. The numbers from 1 to 100 are arranged along the top row and the leftmost column, and each cell in the grid represents the product of the corresponding row and column numbers.
For example:
- Find row 15 and column 20. The intersection will show 300, because 15×20=30015 \times 20 = 30015×20=300.
This chart is an extension of the classic multiplication table, often limited to numbers 1 through 12.
Why Use a 1-100 Multiplication Chart?
The 1-100 chart is more than just a tool; it’s a resource for exploration and learning. Here are a few reasons to use it:
- Comprehensive Learning
With a chart extending to 100, learners can practice larger multiplications, preparing them for real-world scenarios. - Pattern Discovery
A larger chart reveals fascinating patterns, such as:- Perfect squares along the diagonal (e.g., 25×25=62525 \times 25 = 62525×25=625).
- Multiples of numbers forming straight lines, making it easy to spot sequences.
- Faster Calculations
By practicing regularly, you’ll strengthen your mental math skills and be able to recall larger multiplication facts more quickly. - Support for Advanced Math
A 1-100 multiplication chart builds a foundation for understanding more advanced mathematical concepts like factors, divisors, and algebraic equations.
How to Use a Multiplication Chart 1-100
Here are some ways to maximize its usefulness:
- Learn in Segments: Start by focusing on smaller sections (e.g., 1-20) before tackling the entire chart.
- Highlight Patterns: Use markers or colors to emphasize specific multiples, such as multiples of 5 or 10.
- Play Games: Cover parts of the chart and test yourself to recall hidden products.
- Solve Real-Life Problems: Apply the chart to calculate things like area (length × width) or total cost (price × quantity).
Digital vs. Printable Charts
You can find both digital and printable versions of the 1-100 multiplication chart. Digital versions often come with interactive features like highlighting or quizzes, while printable versions are perfect for offline practice or as classroom tools.
Beyond Memorization
While memorizing multiplication facts is valuable, understanding the concept is just as important. Think of multiplication as repeated addition. For instance, 7×87 \times 87×8 means adding 7 eight times: 7+7+7+7+7+7+7+7=567 + 7 + 7 + 7 + 7 + 7 + 7 + 7 = 567+7+7+7+7+7+7+7=56. This approach helps learners grasp the logic behind the numbers.
Fun Facts About Multiplication Charts
- They’re useful for adults, too, especially for quick mental calculations in fields like carpentry, finance, and engineering.
- The chart can double as a teaching aid for other math concepts, such as division or fractions.
Conclusion
The 1-100 multiplication chart is a simple yet powerful tool that opens doors to a deeper understanding of numbers and their relationships. Whether you’re a student learning the basics, a teacher creating engaging lessons, or an adult brushing up on your math skills, this chart offers endless opportunities for practice and discovery.


Leave a Reply